Tezos Draws a Fine Uptrend with a Target to have Persistently Trade Above $3

Tezos partners with T-block Accelerator in order to create a well built and reliable ecosystem for contemporary and innovative blockchain startups in India. Tezos is not based on mining like Bitcoin. Instead, it uses a POS-based consensus model, which briefly means it deploys Proof-Of-Stake for making a blockchain capable of altering its own set of rules. The network here has the least role to play due the same being an on-chain governance model.
With success marking the above venture, Om Malviya, the President of Tezos India Foundation, said, “I am happy to see Tezos India becoming a major partner for the T-block accelerator programme. It will be exciting to see how startups take full advantage of the features that Tezos provides and how it will benefit their business. While assuring complete support, he further added, “We, at Tezos India Foundation, will be there at every step to provide any help, support, or resources necessary.”
Tezos Price Analysis
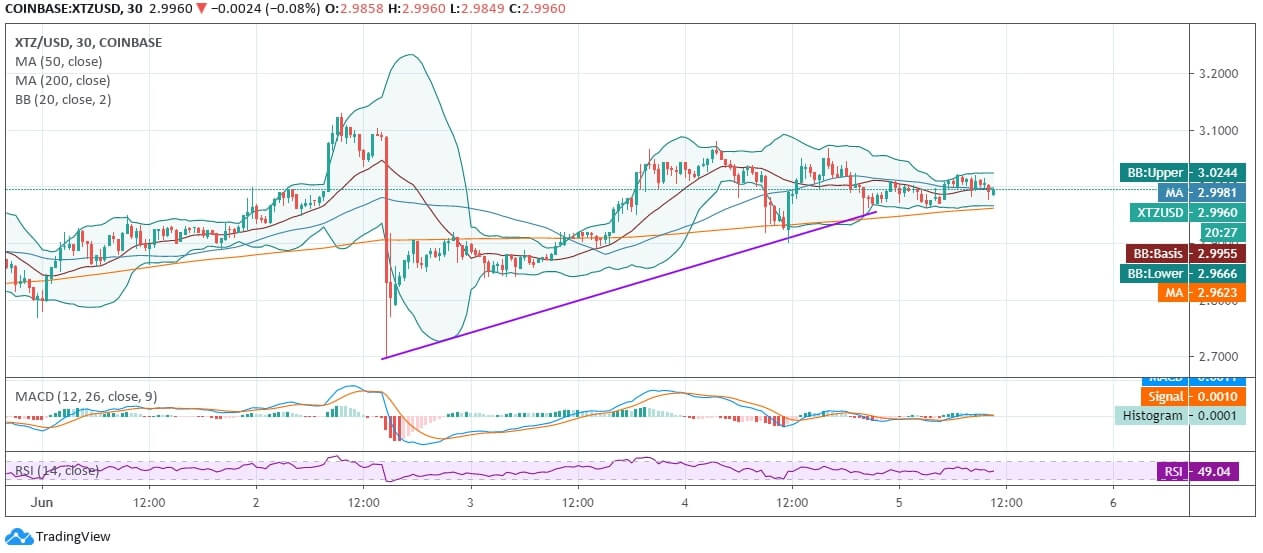
On the half-hourly chart, Tezos had almost recovered from the recent crash that happened earlier this week when the coin had hit bottom at $2.7021. While the 20-day Bollinger Bands laid are do not projecting any unprecedented volatility, which means that this can be coined a real-time recovery. Alongside, many other altcoins like XRP, TRX, and ADA in the process have also marked an astonishing recovery.
XTZ/USD is retaining complete support from 200-day MA while it is yet to regain steady support from 50-day MA at $2.9981. while the crypto currently trades at $2.9960. Alongside this, it has also drawn an uptrend after the crash in the ongoing week, and just when we near the end of the week, we expect the coin to cross above $3 and trade persistently before the market gears up for the next week.
Moreover, today, Tezos was quite a gainer as in the initial hours, it marked the daily high at $3.0204, until the time of writing. So, the technicals hold a bearish crossover until the intraday is concerned, other the MACD is still exhibiting a slight bullish divergence on the half-hourly chart. RSI of XTZ lies at 49.04 and exhibits no trading extremities at the moment.


