NEO/USD Crosses $8.1 After Registering 16% Hike in 30 Days

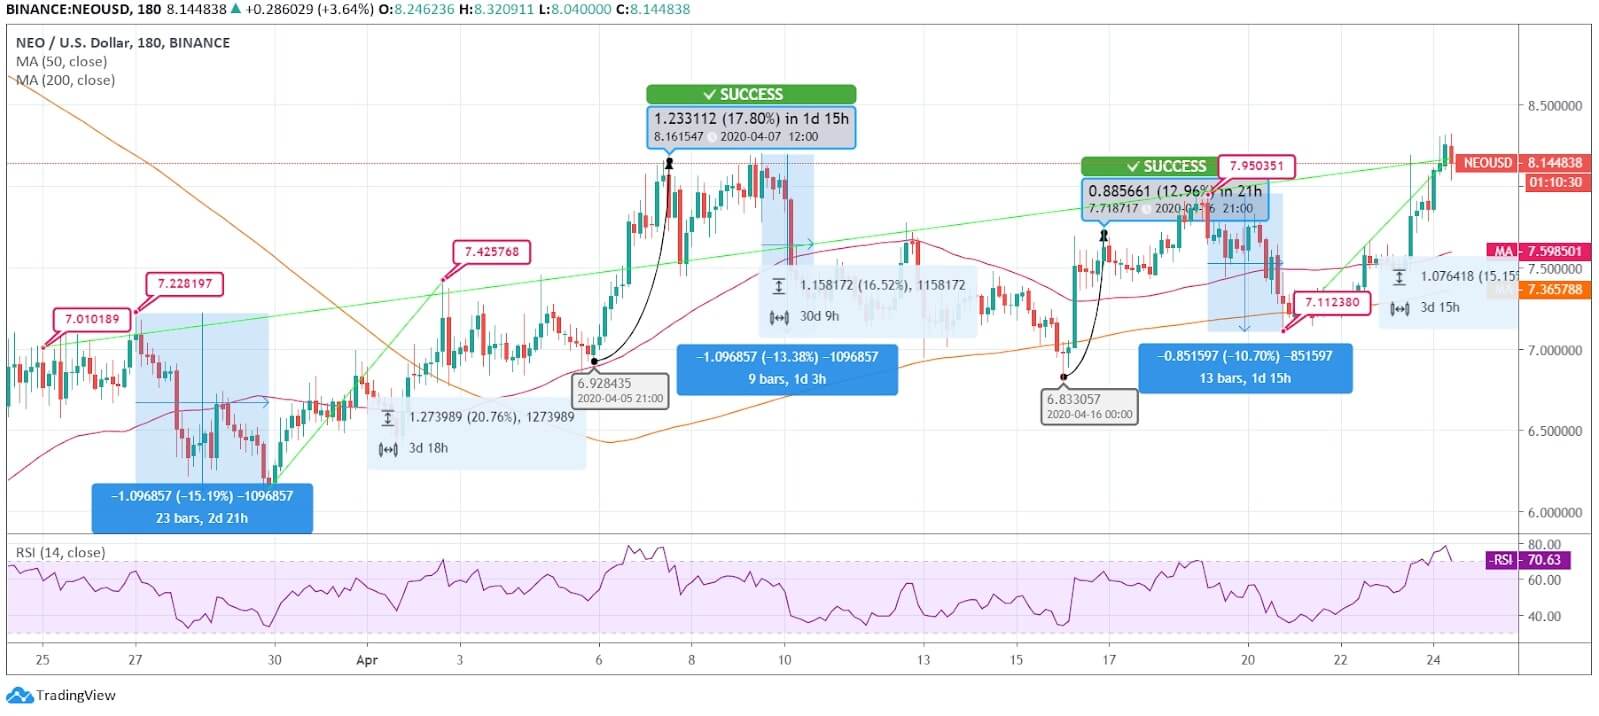
NEO price has improved in ten folds in the past 30 days. The coin has touched $8.14 and is currently moving towards the major resistance level. However, technicals indicators of the currency reflect the possibility of a trend reversal. The regression might embark as the coin has reached its 30-days high.
NEO Price Hits $8.16, Eyes Resistance at $8.4 Next
 NEO Price News
NEO price was at $7.01 on March 25, and then, over the next 2 days, it registered a moderate hike and touched $7.22. However, it was followed by a huge plunge of 15%, and the coin touched $6.23 on March 29. After that, the NEO coin recovered, and on April 3, the price touched $7.42. On the next day, the SMA 50 & 20 of the currency reflects bullish crossover as the 50-day MA crosses above the 200-day MA. And thus, the price escalated with strong upside momentum.
On April 07, the coin marked a 17.80% hike, and the price touched $8.16. Then, it continued to trade in a similar range, but later, on April 10, it faced a steep fall and dropped to $7.26. The next 5 days experienced moderate regression. And on April 16, the price dropped even below $7 and touched $6.83. However, from this low, it escalated to $7.71 on the next day.
Further, Neo coin kept the uptrend intact the price touched $7.95. However, from this high, the price again faced rejection and dropped to $7.11. Later, NEO/USD marked a steady upside movement and touched $8.14 at the time of writing.
The RSI is trading in the overbought region at $70.63. As per the current momentum, the price might test the next resistance $8.4, if continued upwards. However, if the Neo coin face trend reversal, it might find the next support around $7.36.


