Ethereum Price Explodes Above $700 but Appears Intraday Bearish

Ethereum, the largest altcoin of the global cryptocurrency market by market capitalization is seen exploding since yesterday as it currently trades above $700 and even $720 at $722. With Bitcoin maintaining its stance above $26k after hitting an All-Time High above $28.3k, the following 2nd largest crypto is seen spurring too.
Ethereum is believed to an investment of the long -term, and undoubtedly the crypto is doing clear justice to its property of fetching massive gains, reflected by its current price movement. The previous price action of Ethereum was not doing justice as anything below its ATH seems appealing. As per the ETH price prediction, the current gush of momentum is hitting the right chord as the largest altcoin of the global crypto market.
$ETH is undervalued in terms of institutional buying.
Institutional investors would eventually consider $ETH for their portfolio next to Bitcoin.
– @Grayscale $ETH AUM : $BTC AUM = 1 : 7.76
– $ETH Market Cap : $BTC Market Cap = 1 : 6.0727% gap here. They will buy more $ETH.
— Ki Young Ju 주기영 (@ki_young_ju) December 29, 2020
Ethereum is often considered a sibling investment to Bitcoin with the same or may be greater returns when intended to invest for a longer time frame. Also, it is considered lesser volatile than Bitcoin when invested for a comparatively longer time frame.
By the time the Americans get their $2000 stimulus payment they may not even be able to buy 1 $ETH
— Anthony Sassano | sassal.eth 🏴 (@sassal0x) December 29, 2020
Ethereum Price Analysis

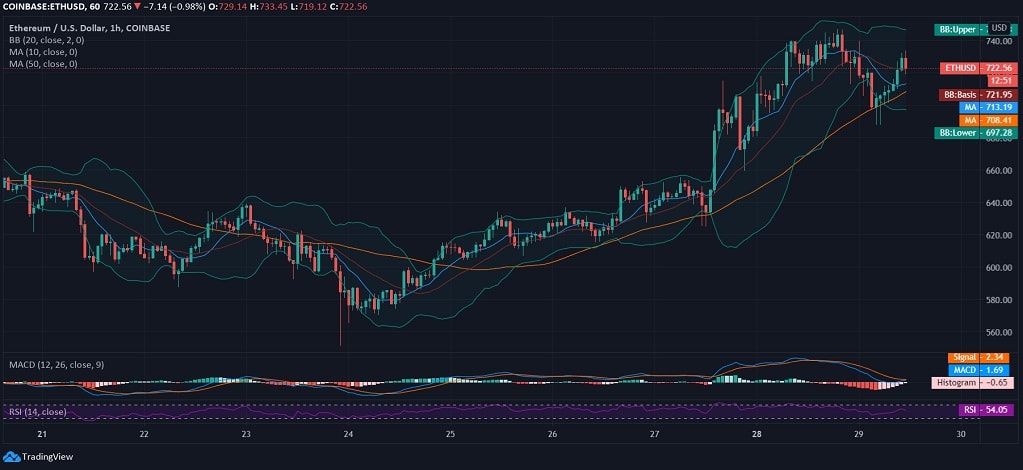
Ethereum, at the time of penning down, was seen trading above $700 and $720 after a long bullish candle and a clear rise recorded in the past 24-48 hours. ETH/USD current price movement is a clear reflection of its capability and power that the crypto holds in the long-term.
On the hourly chart, the ETH coin is holding clear support from 10-day and 50-day hourly MA at $713.19 and $708.41, respectively. However, if we gaze at the intraday movement of the coin, it is clearly exhibited that the coin tested daily support at $687, but with the active backing and traction, Ethereum regained after breaching the lower band.
The intraday bearishness still exists, and therefore, the signal line is seen crossing above the MACD line on the hourly chart, but the RSI is seen lying at 54.05 with no extremities hit on the hourly chart.


