Ethereum (ETH) Lacks Traction and Trades Below $240

Ethereum blockchain is about to complete five years of its existence in the global crypto market towards the end of the month on July 30, 2020. Ethereum has been surrounded by developments initiated towards DeFi to encourage Decentralized Financing. ETH-based Tether will extend its support towards the growing ventures and innovations with the help of Ethereum’s digital asset ecosystem to develop the blockchain space.
Moreover, Ethereum 2.0 was the next big thing in the crypto and blockchain space after the 3rd Bitcoin Halving in the ongoing year. However, the launch of Ethereum 2.0 is now postponed and is now planned for launch in January 2021. This upgrade is believed to be a breakthrough in the blockchain world. It will change the resolution of blockchain technology by creating a safe and passable system that can give neck-to-neck competition to other centralized solutions.
Ethereum Price Analysis
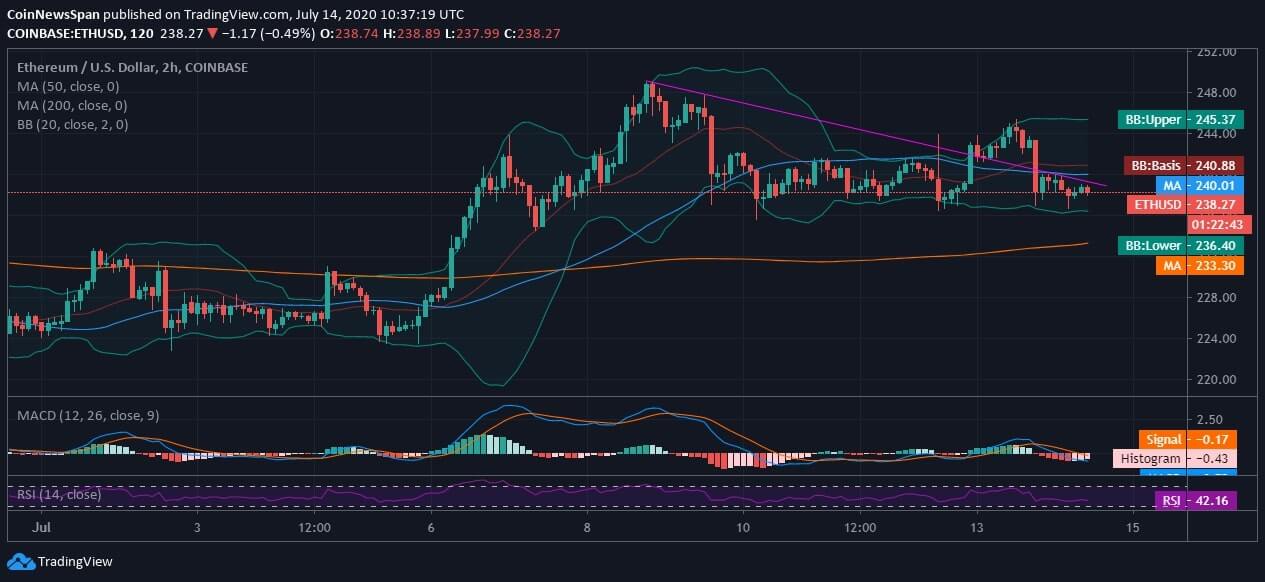
On the 2-hourly chart, ETH/USD reclaimed to monthly heights but lacked the momentum to rise above $250. The massive altcoin by market cap is failing to catch up on the speed of Bull Run that the altcoin market is experiencing otherwise. It was just in the previous week when Ethereum price was seen hitting fresh high just to have an intraday pullback to retest support as low as $235 while currently trades at $238.
Ethereum is clearly facing a dearth of momentum just like Bitcoin and XRP, while altcoins like LINK, DGB, XVG, VET, etc. have hit major resistances in this season. Today, ETH coin lacks support and is inclined towards the lower 20-day Bollinger Bands, and a further plunge will lead to breaching the lower BB. However, as per the 20-day BB, we don’t project any unprecedented volatility in the upcoming days. And, most importantly, the market awaits Bitcoin price breakout for Ethereum and XRP to pump too.
ETH is lacking 50-day MA support after plummeting from $240 price area while retains 200-day MA support at $233. The MACD indicator shows a bearish crossover due to intraday pullbacks. The RSI lies at 42.16 and is seen inclined towards the selling zone yet is away from extremities as it holds support at $233.


