Bitcoin SV Trades Forms a Rising Wedge and Holds a Bullish Crossover

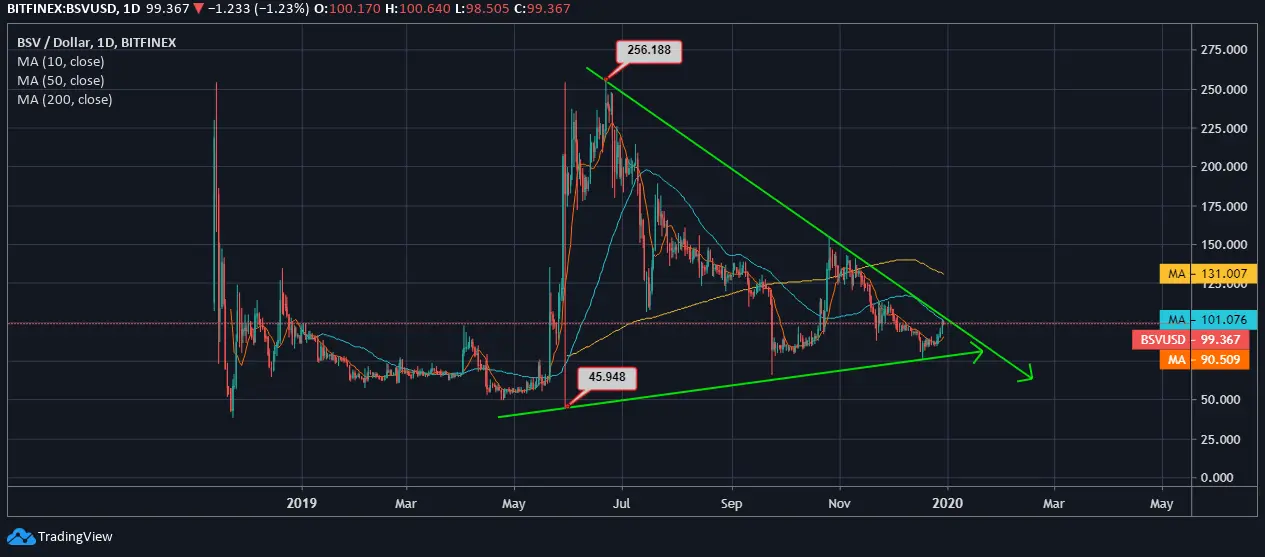
Bitcoin SV, like any other altcoin, has been recording a dip from soaring at $256, earlier this year to currently bottoming out around $99.3. With this BSV and many other altcoins have been only falling in the latter half of the year after BTC took a reverse turn from $13,000 price zone.
However, the degree of a plunge for BSV has been quite considerate as all the major coins have been recording fresh 52-week lows. BSV has been trading with quite a measurable fall as the supports have remained active. With this, the coin gains short-term support i.e., the 10-day MA.
 Bitcoin SV Price Analysis
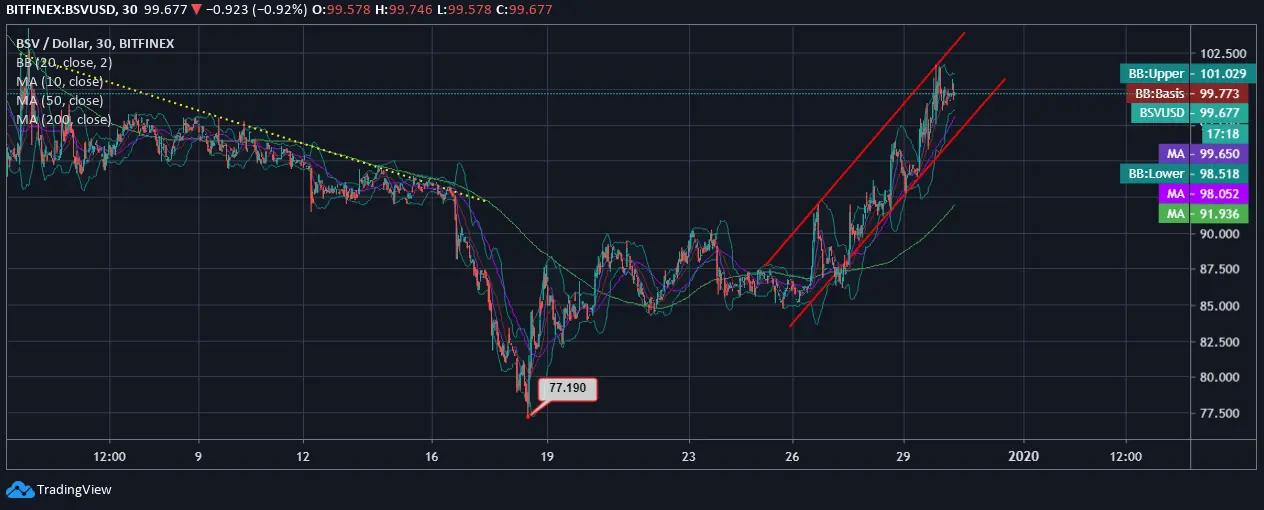
Analyzing the half-hourly price chart of BSV against USD, we see an immediate rising wedge forming as the coin rises from the 7-day low at $85 to currently trading with a growth of over 16%. The price of Bitcoin SV was nosediving at the onset of the last month of 2019.


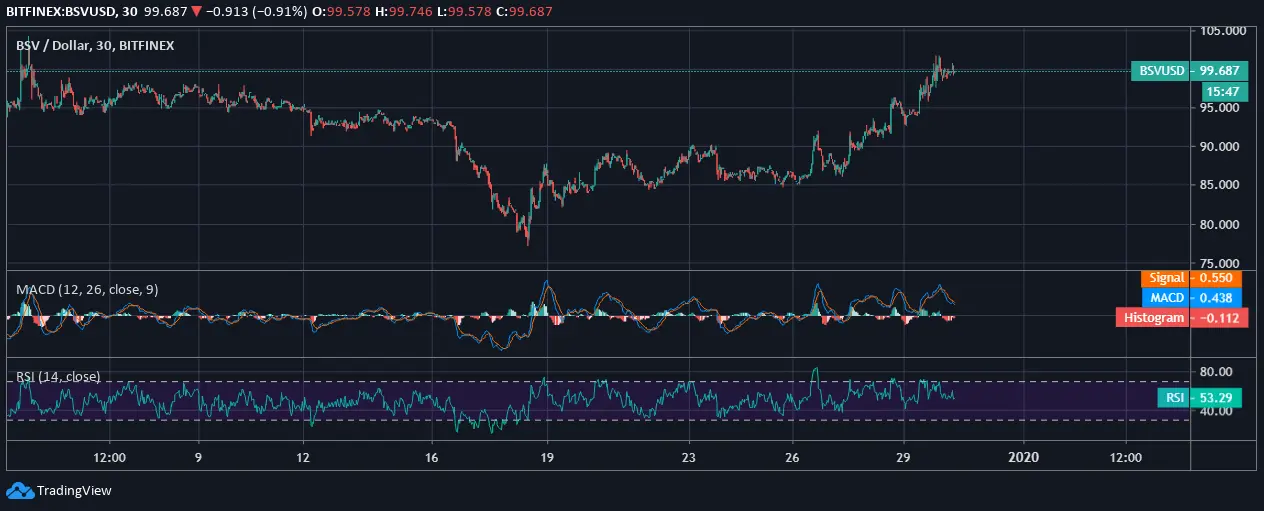
The RSI of the coin is at 53.29 and withholds volatility but shows no extremities at present, rather trades optimistically.


