Bitcoin Cash Marks Bearishness After Hitting the Support of $382

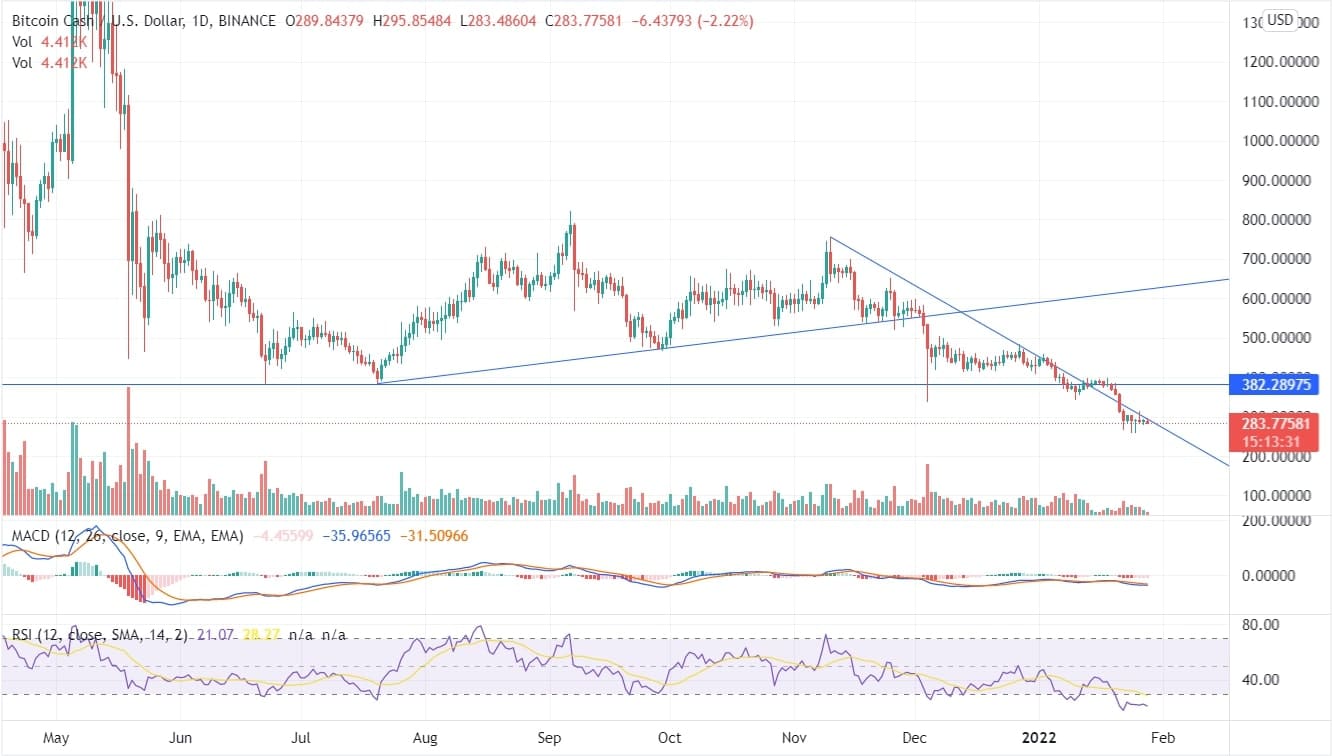
Bitcoin Cash is dropping after being at its high of $755 last November. Over the last two months, the coin has corrected down about 156% and is currently trading at $283. The BCH coin is reflecting downward momentum and is forming lower low peaks. The coin got tested several times at the support line around the price level of $382 but couldn’t ascend and declined further. If we look at the 4-hour time frame, there is a bullish divergence between the price line & RSI, and an upside momentum may occur if the price closes above $314.
 In the above chart, the MACD indicator shows bearishness. Bitcoin Cash had already reduced 40% from when the MACD gave a sell signal. The RSI indicator is at 21 is already in the bearish zone. The BCH coin is revolving at the edges of the downtrend line and hasn’t yet suppressed the trend line. On January 26, the BCH price got tested at the trendline, but it later fell below the trendline. From the previous week, the coin has marked a significant fall. The technical parameters are already demonstrating a bearish zone. In the long run, a turnaround can be expected.
Based on Bitcoin Cash price prediction, the investors may enter the trade once the price closes above or below the swing high or swing low. The price closing below the downtrend line with swing highs doesn’t show much favorable move for bulls. In the past few days, it has displayed mixed trends, and hence, traders face indecision in the crypto market. The BCH price has been moving in consolidated momentum after the downfall from its previous peak.


