April 16th, 2025— Bitcoin price records a slight uptick of 1.54%, teasing a breakout above $85,000. However, the short-term trend in the crypto market has shifted sideways as several countries are engaging with U.S. trade officials to negotiate fair trade deals.
Despite the uncertainty, the onchain activity has shown an emerging accumulation trend among investors, signaling a higher potential for recovery.
Bitcoin Price Recovers with Whale Accumulation in Focus
Since last week, the Bitcoin price has bounced from a $74,568 low to a current trading value of $84,942, accounting for a 14.13% surge. This upswing was initiated as panic selling surrounding the imposed tariff eased in the broader market, and Donald Trump sought negotiations with several countries to attain fair trade deals.
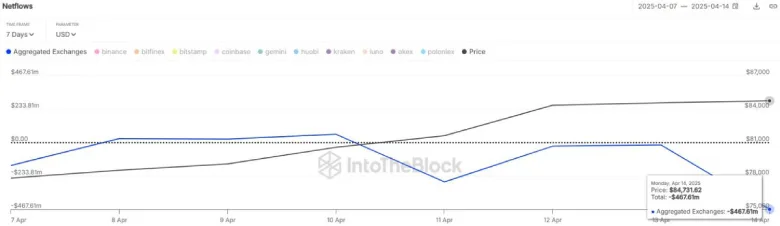
However, the renewed recovery is likely to gain further momentum, as on-chain data shows an emerging accumulation trend. In the past 24 hours, over $467 million worth of Bitcoin has been moved off exchanges, according to IntoTheBlock. This sharp spike in outflows suggests that investors are moving their BTC to private wallets, accentuates their confidence to HODL this asset.
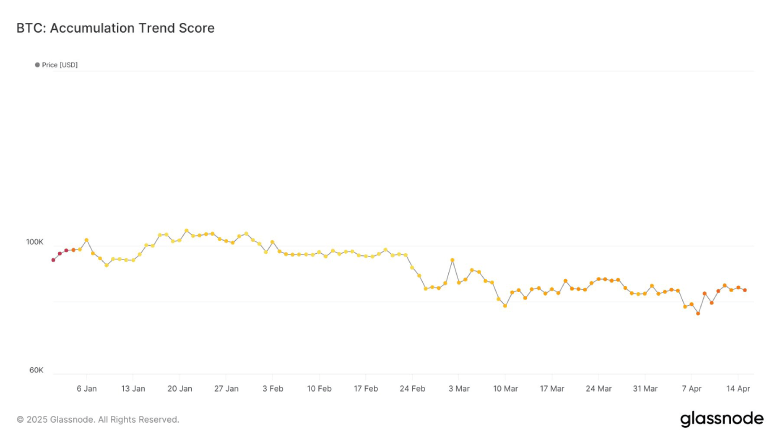
Moreover, Glassnode reports that Bitcoin’s Accumulation Trend Score has reached 0.34, marking the highest level seen so far this year. This metric reflects renewed buying pressure, especially from larger wallet cohorts, and typically aligns with accumulation phases in the market cycle.
Amid the ongoing consolidation, the aforementioned data points to a silent buildup beneath the surface for a potential breakout.
BTC Breakout Signals End of 120-Day Correction
Over the past five days, the Bitcoin price consolidated within the fast-moving daily EMAs of 20 and 50. These levels of dynamic resistance and support have created a narrow range in BTC, reflecting the current market uncertainty.
With today’s price jump, the coin price teases a breakout from the 50-day EMA, along with the resistance trendline of a bull-flag pattern. The chart setup is characterized by an ascending trendline displaying its dominating trend, followed by a short pullback to regain bullish momentum.
If the daily candle closes above the aforementioned resistance, the upside potential will gain sufficient momentum to hit overhead resistances of $91,315 and $100,000 before a new high.
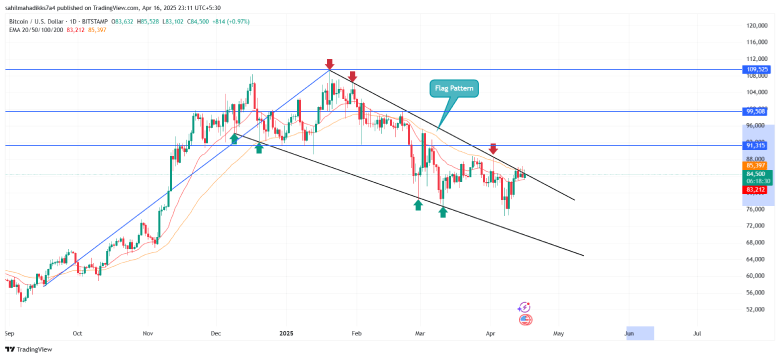
On a contrary note, if BTC reverts below the downsloping trendline, the price action could enter a fresh correction.