DigiByte (DGB) Turns Bearish After Hitting $0.01655 Mark

DigiByte has reflected huge price fluctuations over the past few days. Recently, the currency dribbled drastically, and now the price, which was at $0.0165 on April 25, is now at $0.0107. However, there is still some chance of improvement; however, it may take some time.
DigiByte Price Analysis
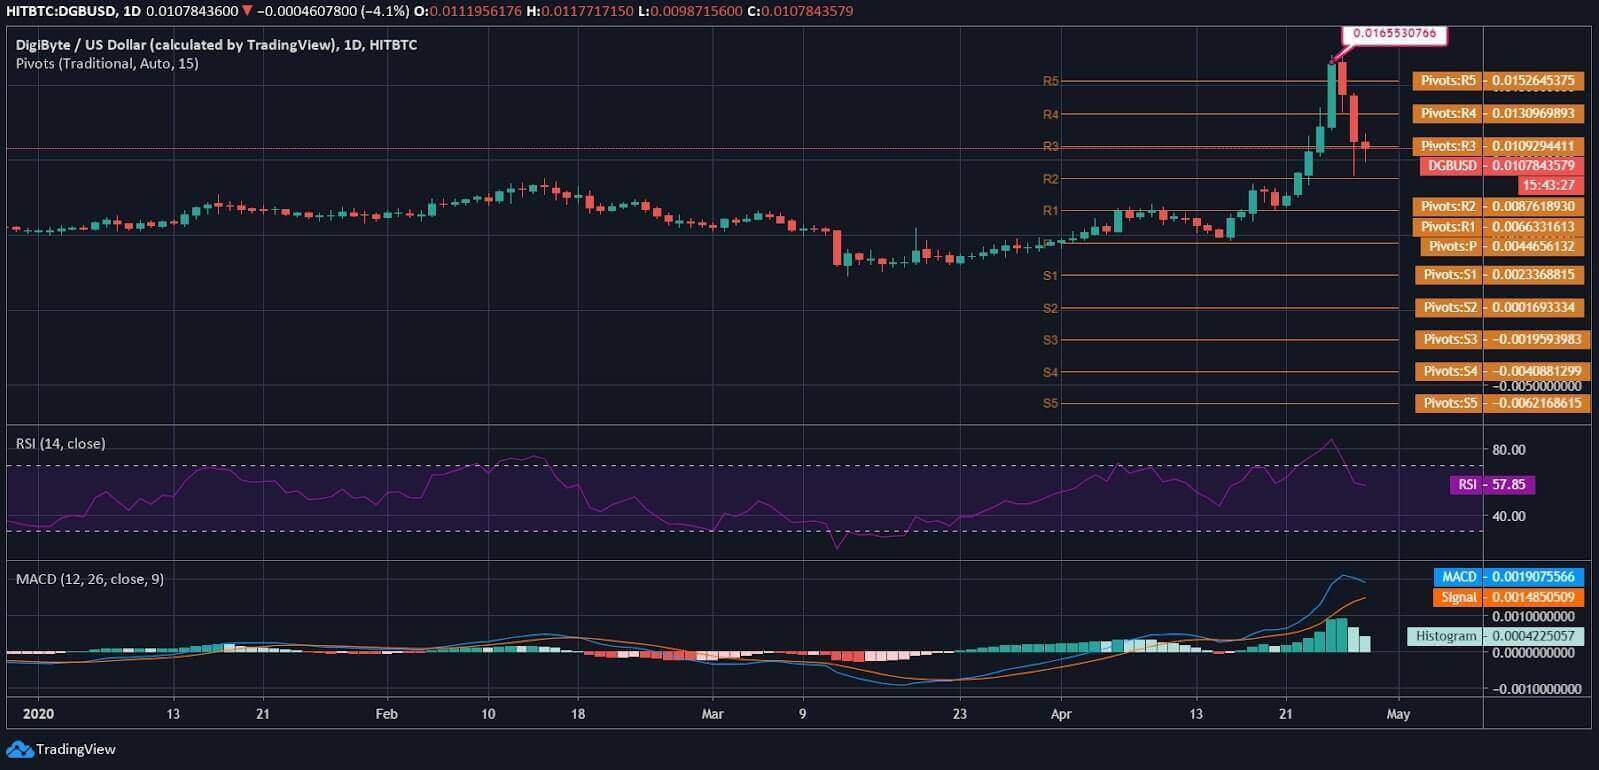
DGB coin began the year with flattish movement, and at that time, the price was trading around $0.0052. Till mid-January, the currency traded at a similar price level. Then, there was a slight improvement observed, which took the DigiByte price to $0.00698. Later, the price remained at the same level until the end of the month. In February, the coin marked escalation from $0.00621 to $0.00868, but then, the price traded downwards, and the month closed around $0.00558.
Further, the DGB price dropped to $0.00337 on March 12, and then, till March 23, the coin price remained at the same level. After that, DigiByte started gaining momentum and ended the month around $0.00455. Later, the currency started trading with bullish influence from the beginning of the ongoing month. DGB coin marked a sharp bullish move, and after crossing $0.0160 mark, it touched $0.0165 and reshuffled the 90-days high. The currency was marginally away from 52-week high at $0.0168.
After hitting $0.0165, DigiByte faced pullback pressure, and hence it started reflecting regression at a tremendous pace. For the last two days, the coin has been dribbling, and the price spotted at $0.0107 at the time of penning down this analysis.
The RSI of DGB coin is at 57.85, and it is tilted downwards. The upcoming period might be regressive. However, the MACD chart is reflecting bullish crossover, but it seems that in the upcoming days, the Signal line crossed the MACD line. As per the current momentum, the price of DigiByte may find the next support around previous resistance $0.087.
