Chainlink Reflects Uptrend; LINK/USD Eyeing for $4 Mark

Chainlink (LINK) price movement seems to bring a moderate fall, but later the same could recover too. The price was at $3.68 during 07:22 UTC of yesterday, and today, it is at $3.73. Hence, the currency gained almost 10% value over the last 24 hours. The possibility of a sharp upside movement would be ripe once the coin breached the resistance level at $3.77.
Since April 2019, the currency marked tremendous growth as it was trading below $0.5 at that time, and now, it is trading above $3.70. At the end of June 2019, LINK’s price was trading around $3.90, but later, it marked downside correction at a tremendous pace and fell to the lowest at $1.59 in September 2019.
From this price point, the currency started trading with moderate momentum, and from the beginning of this year, Chainlink reflected strong recovery. In the last month, it recorded the highest price of the year by touching $4.82. Further, LINK/USD marked steep fall, and the price fell below $2, but then again, it managed to trade above $3.7.
Chainlink Price Analysis

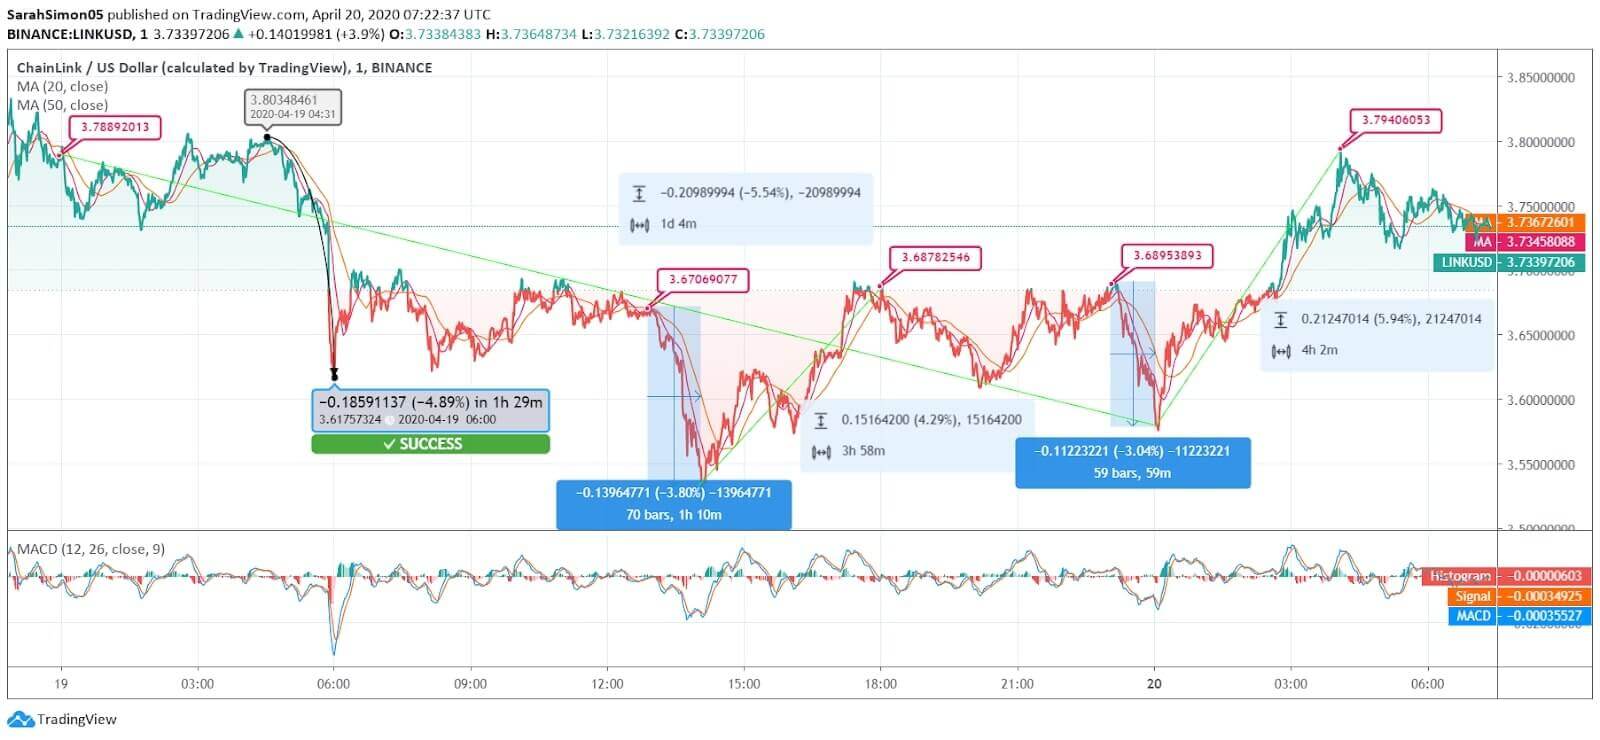
LINK price was spotted at $3.78 on yesterday’s chart during the opening hour. From that, it managed to trade around a similar level over the next 4 hours and reached $3.80. The following hours brought a massive plunge, which took a Chainlink price to $3.61 by 4.89%. The coin picked up the pace and immediately improved to $3.70. With moderate fluctuations, the currency hovered around the same level till 13:00 UTC.
Chainlink price again faced a decline, and this time, the coin touched $3.50 at 14:10 UTC. Later, the price improved to $3.68 by 4.29% hike in the next almost 4 hours. Then, the coin price slipped to $3.62 at 20:22 UTC but further recovered to $3.68 again, and it formed a double top. Before closing, the LINK coin price dropped to $3.58 and closed the day.
Today, Chainlink started the day with massive improvement, and at 03:45 UTC, the price spotted at $3.79. Due to moderate pullback pressure, the coin traded downwards and touched $3.73 at the time of writing. The short-term daily MAs, namely, 20 and 50-days, are at $3.734 and $3.736, respectively. The same is reflecting bearish crossover and pointing towards marginal regression in the coming hours.
The MACD chart is also reflecting a bearish crossover. A few hours ago, the Chainlink price was trading at $3.79 that breached the immediate resistance level at $3.77. However, now, the price is trading below the same. If the market pressure strengthens, then the immediate support level is created at $3.55.


