VeChain Reflects Moderate Uptrend Over the Last 30 Days

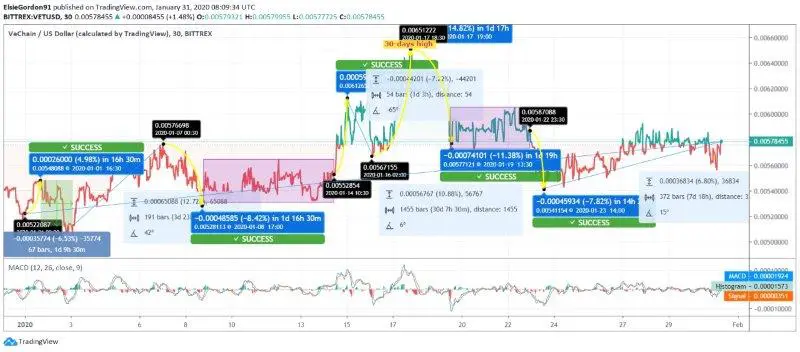
VeChain started the month at $0.00522087, and in the next 16 hours, the price jumped to $0.00548 by almost a 5% hike. On the next day, the currency dropped to $0.00522 by 6.53%. Then, after almost four days, the VET price escalated to $0.00576 on January 07.
On the next day, the VET coin dropped to $0.00528113 by 8.42%. Later, the coin traded around $0.00552 for almost a week and then started improving. The price of VeChain escalated to $0.006126. Further, the coin price dropped to $0.00567 by 7.22% on January 16.
VET/USD Price Chart
 On January 17, the VET price jumped to $0.00651 and breached the 30-days high and set a new at the same. The coin reflected pullback pressure immediately after the same. The currency slipped to $0.00577 by a massive drop of 11.38% at 13:30 UTC on January 19. Then, VeChain price was again seen locked, but this time around $0.00587. The price dropped to $0.00541 by 7.82% on January 23. Further, the momentum improved, and VET price escalated to $0.00578.
As per the MACD indicator, the MACD line overpowers the signal line, which hints the upward movement in the upcoming hours. VeChain coin has violated the immediate resistance level at $0.00576. The traders are expecting the heavy improvement to take place in the coming month.
| Resistance Level | Price |
| R1 | $0.005769 |
| R2 | $0.005881 |
| R3 | $0.005938 |
| Support Level | Price |
| S1 | $0.0056 |
| S2 | $0.005543 |
| S3 | $0.005431 |


