Dash (DASH) Lacks Potential; Trades Bearishly at $51

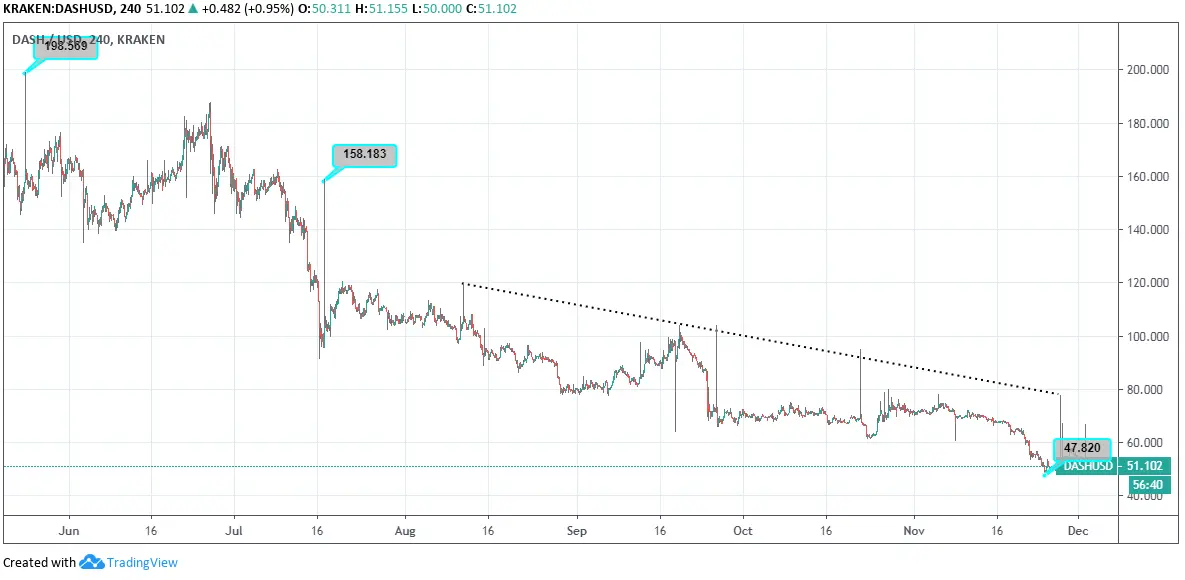
- Dash currently trades at $51.102 after having a rapid slip from $78.26
- The price hit rock bottom giving a fresh 52 week low at $48.49 in the previous month
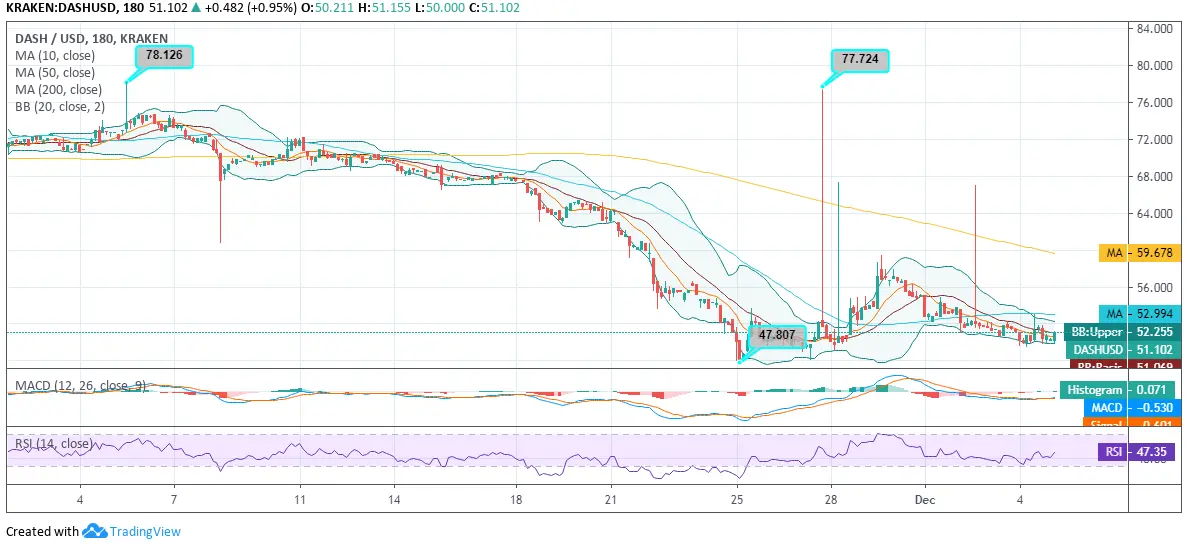
- The coin has a slight support from the 5-day EMA and SMA
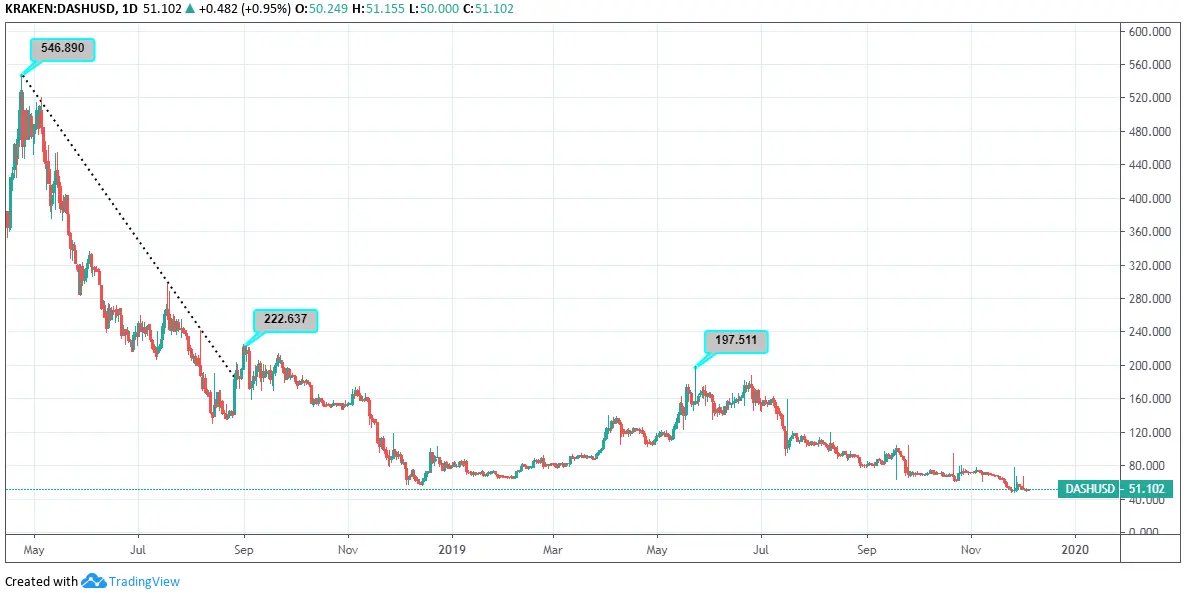
Within the past six months, Dash has soared around the price range of $198. Since then, Dash is on a continual downslide as observed from the price trend. In the past six months, Dash has faced a firm rejection above $158 price area, and since then, we have had no notable traces on the upside.
 Dash Price Prediction

Similarly, if we connect the dots as we near the end to the ongoing year 2019, will Dash price continue to trade at the uttermost bottom?
Looking into a closer view of the previous month as it was the month of maximum volatility faced by all the major coins viz., Bitcoin, Ethereum, and XRP.

Towards the end of the previous month, Dash price tried to rise but unable to battle the inactive supports, and hence, it continued to face strong rejections.
The formation of the Bollinger Bands is such that they seem to have a narrow opening, which may lead to another downside break below $51 as per the current trading scenario.
The MACD of the coin also confirms the bearish pressure as DASH/USD runs below zero, and the signal line overpowers the MACD line.
While the RSI of DASH is 47.35 showing no extremities but an inclination on the downside.


